The following sections detail the structure used to report narrative and emission data in the report:
Narrative
Narrative type data either displays as narrative text or as a table with value entries.
Narrative Control List Table Display
Control list entries display as tables in the report. For definitions with one control list assigned, the control list title is the column one header, and the column one entries display the control list members. All values entered for the control list members display in column two.
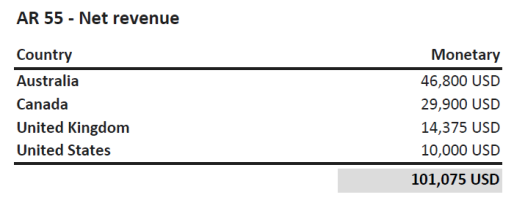
If a definition has two control lists assigned to it, the data entered for that definition displays as a table with multiple columns.
| Report Column | Description |
|---|---|
| Column 1 Header |
The name of the first control list assigned. |
| Column 1 Entries | The members in the first control list. |
| Column 2 Header |
The name of the second control list assigned. |
| Column 2 Entries | The members in the second control list. |
| Column 3 Header | The definition unit type. |
| Column 3 Entries | The values entered for each control list member on the Home page. |
NOTE: All control list members display in alphabetical order.
If the definition has an aggregable unit type and there are two control list assigned, the subtotal amount for control list one is bold in the corresponding row. The total amount for control list two displays at the end of the table.
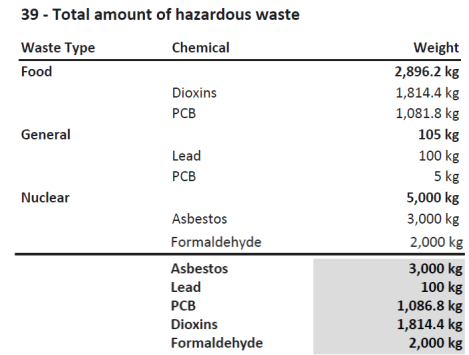
NOTE: The following definition unit types do not aggregate on the report: Average, percent, date, and narrative. All other definition unit types display totals on the report.
Scope 1
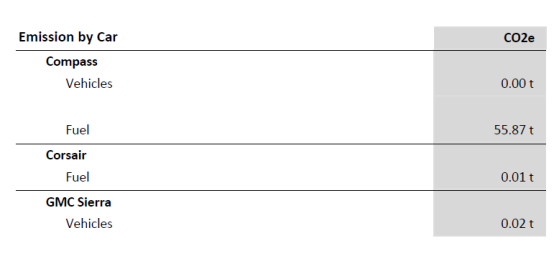
The Scope 1 report section provides a summary table displaying all emission categories and their total CO2e emissions.

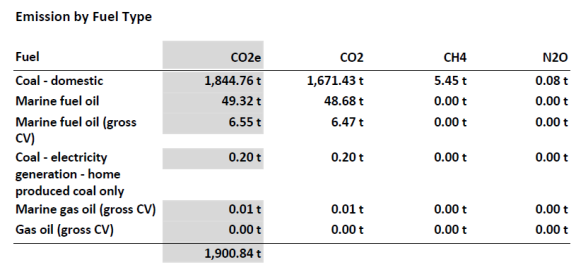
The report breaks down the CO2e emissions by category. The table for each category lists the factor name and displays the CO2e emission for each factor with the category CO2e total highlighted. The category types are sorted in the table from highest to lowest based on CO2e. The report also shows the CO2, N2O, and CH4 calculations.
Factor Control List Table Display
Control list entries display as tables on the report. The title of the category contains the control list name and each control list member displays as a bold row header. The total CO2e aggregates and displays in the control list member row.
Scope 2
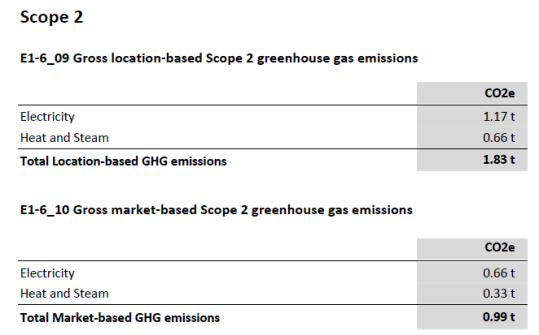
The Scope 2 section reports Market-based and Location-based utility usage. The contracts entered by the Administrator on the Contracts page are used for the market-based utility usage calculation. The Market-based calculation uses the entered value for purchased utility and subtracts the contract value of the utility for the compliance year to provide the CO2e total.
Location-based and Market-based usage displays on two separate summary tables. Each table shows the utility calculation for each category with the total amount bold below the table.
Scope 3
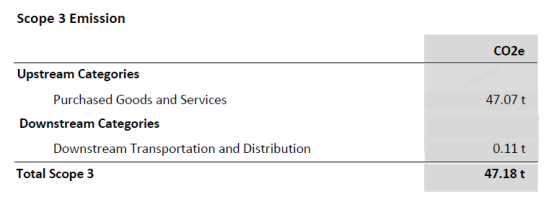
The Scope 3 section reports indirect upstream and downstream emissions. The report provides a summary table displaying all upstream and downstream categories with their total CO2e emissions. The scope 3 total emission is bold below the table.
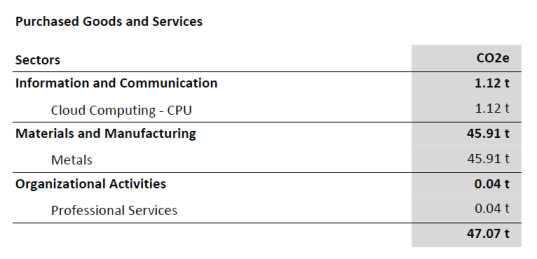
The report breaks down the CO2e emissions by category. The table for each category lists the factor sectors with the factor categories below in each column. The total CO2e column for each is highlighted with the CO2e total bold below the table.
Retrospectives and Targets
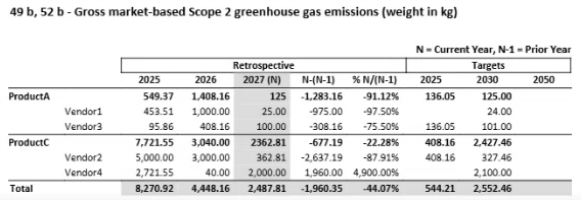
When you are reporting Scope 1-3 data for emissions in the ESRS framework, additional columns for Baseline Year, Prior Year, Milestone Year, and variance calculations will display on the report if those options are selected. The Target columns display based on the Milestone years selected on the Global Options page. If additional milestone years are selected in Global Options, the report will expand to include those target years in the order they are set up in. See Global Options and Manage Definitions.
Each column will display data based on what is entered in the corresponding Workflow Profile. The column displaying data for the current year is highlighted in gray. The N-(N-1) column displays the variance between the Current year (N) and the Prior year (N-1). The % N/(N-1) column displays the percent change between the Current year (N) and the Prior year (N-1).
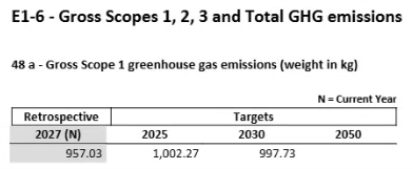
The following image displays single control list integration with Retrospective and Target columns. Each control list member is a row in the first column.

The following image displays two control lists integrated with Retrospective and Target columns. Each control list member is a row in the first column, and the second control list members are rows in the second column. The subtotal amount for each member in control list one is bold in the corresponding row.
